LAD and Lady Charts
There are two important factors involved in the production of grading and release printing. Firstly the grader and the Control Department have to be confident that if a grader decides a certain scene requires, for example, Light 24 (Red=24, Green = 24 and Blue = 24 for a black and white scene using Model C grading) it is vital that should the same or equivalent scene comes up for grading in a year's time and it is given the same light then an identical print will be produced. The Control Department is responsible for this happening.
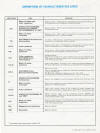
The processes, printers and apparatus such as video analysers all have to be kept constantly calibrated. The processes are controlled by regularly processing step wedges or strips as they are usually called and measuring them on a densitometer. The various parameters for that process can be calculated and plotted so that the process can be kept within tolerance. Kodak for many years have operated the Inter-laboratory Survey, they provided standard process strips to all participating laboratories around the world. The strips were returned to Kodak and results were returned to the laboratory as shown in the sample below. This enabled Kodak to be sure that all laboratories were processing their stock to get the best possible results and confirmed to the laboratory that their internal measurements had not drifted away from the standard.
The second important factors is for the laboratory to be confident that release prints are as nearly identical whether they were printed today or in three years time or even on a different printer. In addition if a negative is sent to another laboratory for printing they can tell that the grading will give the right result in their system of controls.
Step wedges give all the information that is needed other than it does not give much understandable visual information. In addition with printing machines it is not necessary to have a complete plot to check the printer balance. The printer balance is the term used to indicate whether the printer is on aim or not. For this reason Lady charts were devised. They seemed to invariably contain pictures of ladies, hence the name lady chart. They have the advantage that anyone with good, normal colour vision can see if it is correct,
As well as laboratories, camera hire companies, cameramen and optical houses used pictures and gray scales so that they were able to check the colour quality of their rushes, picture 12 shows a grayscale photographed for the Fairbanks picture 'The Black Pirate" from 1926. Picture 10 is from Joe Dunton Cameras, .Picture 11 is from General Film
When colour became common in laboratories the difficulty occurred of the variation in skin colour so the China Lady was devised (Picture 7). As is obvious, the lady photographed was made of china and the skin tone could be completely controlled and didn't depend on whether the model had been sun bathing or not!
The lady test is normally cut into the Academy leader; because laboratories were always thinking about costs they only rarely purchased brand new Academy Leaders and preferred to duplicate from one they already had. Over the years the leader would be copied again and again and the resulting increase in contrast (not important for the numbers on the leader) gradually distorted the lady test that might have been cut into the leader until the picture became impossible to identify (Picture 4).
Many laboratories had their own lady tests and there was not really any universal standard, picture 6 and 14 are from Technicolor laboratories and also serves to identify cyan, magenta and yellow separations. The BKSTS produced standard negatives (Picture 8 and Picture 9, interesting because it also contained a man). The late John Pyltak of Eastman Kodak devised the Laboratory Aim Density test negative known as an LAD (Picture 13). This had calibrated white, gray and black patches and Kodak, and eventually all other manufacturers issued figures that should be achieved for these patches for all film stocks. Figures were quoted for duplicating stocks so that laboratories knew that their intermediate stocks were being printed to give optimum results. You take the Eastman Colour LAD Negative and make an interpositive from it, you then measure the density of the gray patch and calculate whether you need to increase, decrease and/or alter the colour balance to get a correct interpositive figures.


